

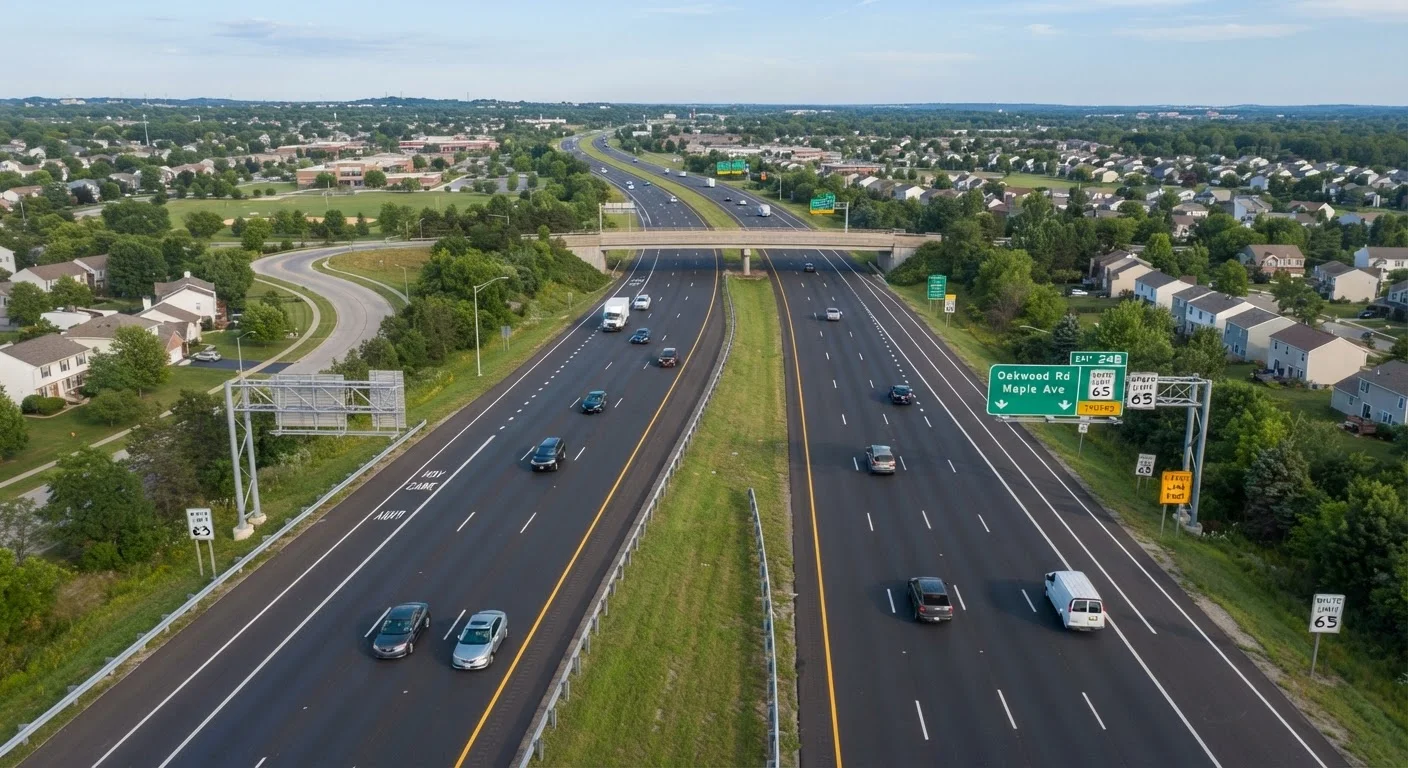
How Traffic Engineers Determine Speed Limits
Speed limits in the U.S. are not assigned by legislators picking convenient numbers. They emerge from a structured process involving traffic engineering studies, road classification, and - in most jurisdictions - a benchmark known as the 85th percentile rule.
Under this methodology, engineers observe vehicle speeds on a given road segment under free-flow conditions (light traffic, good weather, no enforcement presence). The speed at or below which 85% of drivers naturally travel is then used as a reference point for setting or adjusting the posted limit. The reasoning is that most drivers self-regulate to a speed they perceive as comfortable and safe for road conditions.
However, engineering studies are only one input. Regulators also weigh crash history at specific locations, road geometry (curves, sight distances, grades), the presence of pedestrians and cyclists, adjacent land use such as schools or shopping centers, and the volume and mix of traffic. A straight rural highway and a curved suburban arterial with school crossings will have very different limit-setting considerations - even if driver behavior surveys suggest similar free-flow speeds.
The 85th Percentile Rule Has Limits
While the 85th percentile methodology is widely used across U.S. jurisdictions, it is not the only tool regulators apply - and it has faced criticism for centering driver behavior over vulnerable road user safety. Many cities now supplement or replace this approach with survivability-based frameworks that ask: at what speed is a collision survivable for a pedestrian? Context, road classification, and the presence of non-motorized users all influence which methodology applies.
What the Research Says About Speed and Crash Severity
The physics underlying speed limit policy are unambiguous: kinetic energy increases with the square of velocity. A vehicle doubling its speed does not simply double its crash force - it quadruples it. This relationship drives much of the evidence regulators use when evaluating posted limits.
Crash outcome research consistently demonstrates that pedestrians struck at lower vehicle speeds have significantly higher survival rates. Studies cited by the National Highway Traffic Safety Administration (NHTSA) indicate that a pedestrian struck at 40 mph faces a dramatically higher fatality risk than one struck at 20 mph. The same physics apply to vehicle-to-vehicle collisions and single-vehicle crashes.
~29%
Share of U.S. traffic fatalities involving speeding
According to NHTSA, speeding is consistently implicated in roughly a quarter to a third of all annual traffic fatalities in the United States.
4x
Increase in kinetic energy when speed doubles
Basic physics: kinetic energy scales with the square of velocity, meaning doubling speed quadruples crash force - a core principle behind speed limit safety policy.
90%+
Pedestrian survival rate at 20 mph impact
Safety research, including data referenced by the World Health Organization, indicates pedestrian survival rates drop sharply as impact speeds rise above 20-30 mph.
Beyond pedestrian impacts, speed is implicated in roughly a third of all U.S. traffic fatalities annually, according to NHTSA data. Speeding - defined as exceeding posted limits or driving too fast for conditions - reduces a driver's ability to steer around hazards, extends stopping distance, and increases crash severity when contact occurs. This is why understanding speed limits connects directly to broader driving safety habits; safe following distances, for instance, become even more critical at higher speeds. See our guide on tailgating risks for more on how speed and following distance interact.
What Happens When Speed Limits Change
Regulators don't set speed limits and walk away. Changes to posted limits are typically followed by before-and-after studies that track crash frequency, crash severity, and driver compliance. This evidence base informs future policy decisions.
Research on raised speed limits has generally found unfavorable safety outcomes on high-speed roadways. A widely cited analysis published in the American Journal of Public Health examined speed limit increases on U.S. interstates and found a statistically significant association with higher traffic fatality rates over the years studied. Conversely, reductions in speed limits in urban areas - particularly in pedestrian-dense zones - have been linked to measurable reductions in serious and fatal crashes in cities that have implemented such changes.
The evidence is not uniform across all road types. On some rural interstates, modest limit increases had limited measurable impact on fatalities, partly because driver behavior was already close to the new limit and road design accommodated higher speeds. Context matters significantly in interpreting these studies.
Understanding speed limit evidence also reinforces other foundational road safety concepts. New drivers, in particular, learn the relationship between speed choice and crash risk early in their training - explored in depth in our article on what new drivers are taught about road safety. Speed also intersects with intersection risk: higher approach speeds reduce a driver's ability to react to cross-traffic or signal changes, a topic covered in our piece on intersection hazards and how to reduce them.
Ongoing Debates in Speed Limit Policy
The 85th percentile methodology has faced sustained criticism from pedestrian safety advocates and some traffic engineers. The core objection is a potential feedback loop: if drivers routinely exceed a posted limit, a new speed study will capture that elevated behavior, potentially justifying a higher limit - regardless of whether the higher speed is actually safer for all road users, including pedestrians and cyclists.
Urban speed limit reductions - sometimes called '20 is plenty' or Vision Zero policies - reflect a deliberate departure from driver-behavior-centered methodology. These frameworks prioritize survivability targets: setting limits so that collisions, when they occur, are less likely to be fatal. Several U.S. cities have lowered default residential and urban speed limits under such frameworks and are tracking outcomes.
Speed cameras and automated enforcement represent another policy lever, used widely in Europe and in select U.S. jurisdictions. Evidence from international deployments generally shows reductions in average speeds and associated crash metrics in monitored zones, though implementation, public acceptance, and legal authority vary considerably by state.
For drivers, the practical takeaway is straightforward: posted speed limits represent a floor of regulatory judgment built from engineering, crash data, and road design - not an arbitrary ceiling. Treating them as the maximum permissible speed under ideal conditions, rather than a target, remains one of the most well-supported safety behaviors available to any driver.
Frequently Asked Questions
Traffic engineers conduct speed studies, review crash histories, and assess road geometry and surrounding land use. A common benchmark is the 85th percentile speed - the pace at or below which most drivers naturally travel. State and local authorities then set statutory limits, sometimes overriding engineering recommendations.
Research generally indicates that higher speed limits are associated with more fatal crashes. A study published in the American Journal of Public Health found that raising interstate speed limits across the U.S. was linked to increased traffic fatalities over the years studied. The relationship between speed and crash severity is well-established in safety science.
Speed limit authority largely rests with individual states, which set their own maximums for different road classifications. Rural interstates in some western states permit up to 80 mph, while densely populated urban corridors may cap at 25-30 mph. Land use, pedestrian density, and political factors all influence these decisions.
The 85th percentile rule sets speed limits at the speed at or below which 85% of drivers travel in free-flow traffic. Critics argue this can create a feedback loop - as drivers speed, the 'natural' speed creeps up, which in turn raises posted limits. Safety advocates argue the method prioritizes driver behavior over pedestrian and cyclist safety.
Evidence strongly supports that lower speeds reduce fatality risk. Physics explains much of this: kinetic energy increases with the square of speed, so a vehicle traveling at 40 mph carries far more crash force than one at 25 mph. Pedestrians struck at lower speeds have substantially higher survival rates.
The content on this site is provided for informational purposes only and should not be considered a substitute for professional advice. While we strive to provide accurate and up-to-date information, we make no guarantees regarding its completeness or accuracy. Always consult a qualified professional for advice specific to your circumstances before making any decisions.